Graphing an active SPAM attack in progress
Tags: email, firewall, hacking, linux, security, spamI woke up this morning to very slow response time on my server, and decided to check the statistics. I graph these things with a great deal of detail so I can see precisely when it happened and begin narrowing down where I need to go to fix it or report it upstream.
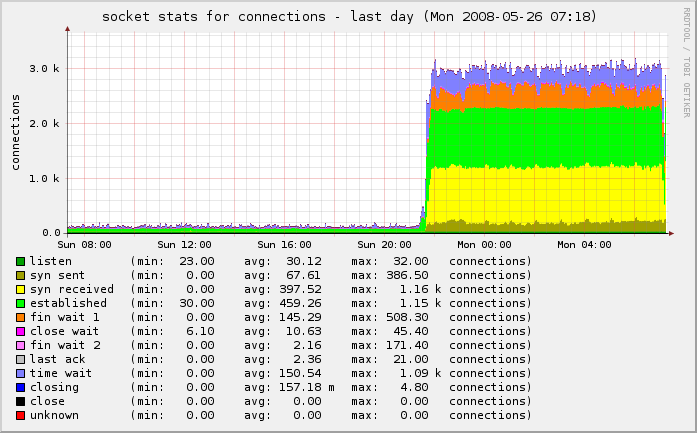
In this case, my incoming connections went from under 500/second to well over 3,000/second. Owch!
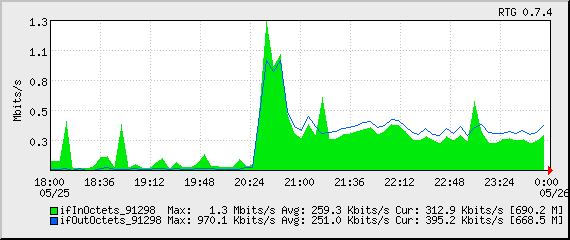
You can see the “wall” of traffic growing from our normal traffic rate to this enormously-increased rate:
I checked all of the services, logs and protocols and didn’t see anything out of the ordinary. I started shutting down services one at a time and regenerated the graphs, to see if I could see any change.
One thing I noticed was that I had poppassd open on the public port. Not a huge problem, but it was something that was unnecessary on the public interface. I locked that down with iptables:
$IPT -A INPUT -s ! 127.0.0.1 -d ! 127.0.0.1 -p tcp -m tcp --dport 106 -j DROP
But as I looked further, I noticed even more:
netstat -tulpn | grep LISTEN
This showed that I had Squid listening on the public interface as well (0.0.0.0:3128). I jumped to the squid logs and was shocked to see that they were scrolling so fast that I couldn’t even read them. Ut oh!
Apparently some enterprising young spammer found my squid instance and decided to try to hijack it for his own needs. It was already locked down internally in my squid.conf to restrict use from only my block of IPs, but he was hammering it with 8,466 separate IPs trying to use it to send spam on port 25.
# cat access.log* | cut -b20-300 | grep ':25' | perl -lne 'print /((?:\d+\.){3}\d+)/' | sort | uniq  | wc -l
8464
Damn! There goes a few gigabytes of bandwidth that were eaten in the last 11 hours while I was sleeping.
I locked that down in a similar fashion:
$IPT -A INPUT -s ! 127.0.0.1 -d ! 127.0.0.1 -p tcp -m tcp --dport 3128 -j DROP
A bit more poking around with nmap, netstat, Webmin, HotSanIC and other tools allowed me to lock down some other services that incorrectly bind to the public interface and not the internal interface.
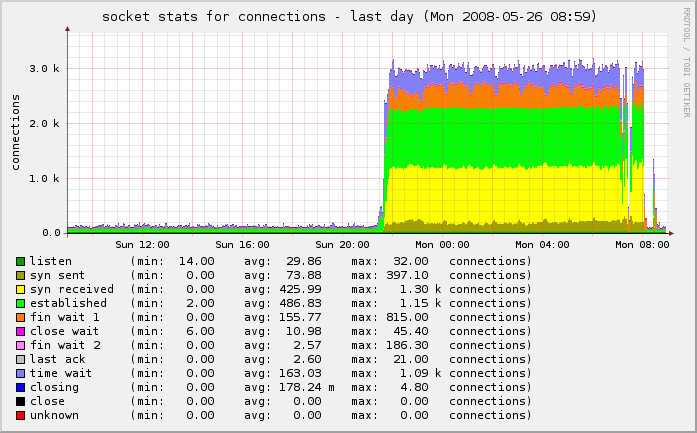
The result is that we’re back to normal:
One last piece needed my attention. Because this was an active spam attack, propagated using the IP of my server as a vector, I had to make sure to check my mail logs and delist myself from the various RBLs who had listed me as a spammer for sending out 43,745 separate spam attempts through my IP in a matter of hours.
SpamCop originally listed me, but I corrected that, and a few others. I also reported it to my provider so they can be sure to keep a closer eye on it.
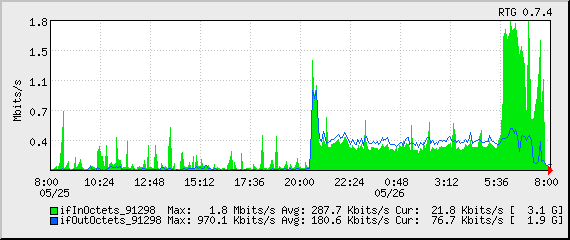
You can see the drop-off on the far right of the last two graphs above and in the traffic graph below.
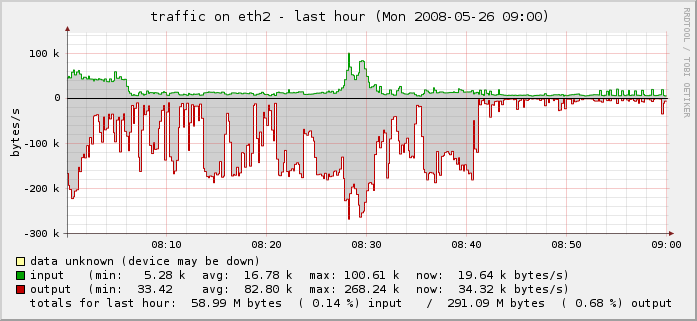
Problem solved.
